
Take care of Data & AI Literacy - to bring your company to the next analytical level
Take care of Data & AI Literacy - to bring your company to the next analytical level
Can it be as easy as driving a car?

Maybe it is because I worked in the automotive industry, that I like comparisons with automotive things. Therefore I also like the similarity between car driving and Data Literacy. Let’s go!
What is Data Literacy?
Data literacy is the ability to read, write and communicate data in context, with an understanding of the data sources and constructs, analytical methods and techniques applied, and the ability to describe the use case application and resulting business value or outcome.
- Gartner, 2022
Recently I saw the term “AI Literacy” rising. I assume we can understand this as a new need in the context of the LLM (Large Language Modells) hype started with ChatGPT.
What is AI Literacy?
AI Literacy is the ability to effectively, ethically and responsibly understand, utilize and guid AI systems.
I discussed on LinkedIn if this is really a different kind of Literacy and got a nice perspective from Alois Nyamarebvu:
➡ As we read data we need to understand the influence of AI on it.
➡ As we write data we need to grasp how to utilize AI to write efficiently and effectively.
➡ As we communicate data (insights) we need to know how AI can aid or influence both insights extracted and action inspired.
➡ As reason with data we should understand how our AI choices have influenced the decisioning cycle inc. conclusions and choices we make.
AI literacy focuses on understanding and applying AI technologies **in context**, which require distinct skills and knowledge beyond the foundational data competencies data literacy establishes.
As we are subject to continuous development in “data”, I still see it as an integral part of Data Literacy. But we have to be and get more aware, that topics like AI ethics and AI responsibility plays a role. For some people ChatGPT might be like Clarke’s law “Any sufficiently advanced technology is indistinguishable from magic.“. But it possibly should rather be understood as switching from a classic car to a Tesla.
I will therefore stick to the term “Data Literacy” in the following text, which also includes AI Literacy.
Data Literacy can be the glue, to bring all your data activities together and make them work in the enterprise. Data Literacy is, on the one hand, a personal competence but for a company to enable data literacy, is partly another thing altogether. To make it work in a company it needs to be considered as part of a overarching data strategy. A data strategy should include the following parts:
A clear vision and goals undertandable to your employees and aligned with the corporate strategy
A target operating model making your strategy work in your organisation
A data architecture that alignes your business capabilities to create value from data
A data governance for guardrails and responsibilities to minimise risks and provide guidance
A data culture allowing Data Literacy to be effective and make your data perform
So many things have to come together, but still, Data Literacy is something that is related to all aspects and cannot be started early enough!
Data Literacy - as Simple as Driving a Car?
So a first question is often - “Where am I with Data Literacy in my company?”. If available you could work with a maturity model but sometimes a few simple questions are also a good indicator:
Do business people and IT people speak about the same things when it comes to data? Or do they just think they do?
Is Data Literacy part of your job descriptions?
Do you see that decisions being justified with data but not based on data?
If you see data initiaitives do you see fancy 3D pie charts and focus on classic reporting instead of predictive or advanced analytics?
A Look in the Rear View Mirror
I like to work with the following graph, which I first saw here. Many traditional companies (compared to start-ups or data-first companies) start here and over time take their way from left to right. Not always in a straight line.
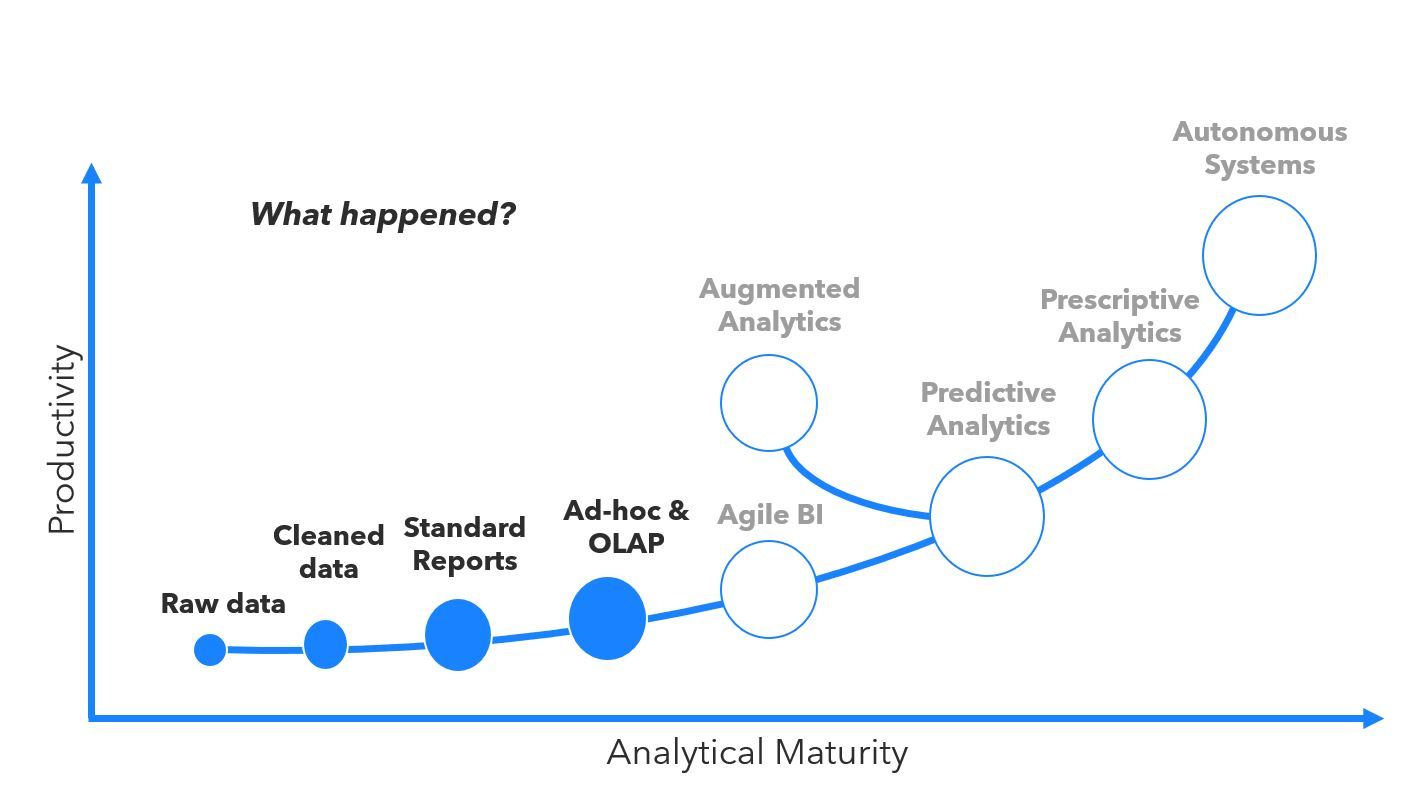
Fig. 1: Analytical Maturity Curve - What happened?
Imagine you drive a car 20+ years ago. Everything works in a mechanic mode. It brings you everywhere but you have to sit in the driver seat, doing everything on your own while your passengers enjoy the ride.
This is also where classical Business Intelligence with vendors like SAP, Microsoft, Qlik, Tableau, MicroStrategy and others come from. It is still a strong cornerstone of data usage today.
This approach is very common and helpful. It shows you what happend and is able to help you make better decision, optimise processes and evaluate risks. From my understanding 60-70 % of Data & Analytics projects and activities happen here. Most organisations are able to deliver here today.
Data Literacy is here to help you make better use of data and technologies. Besides understanding how the tools work and how you "get your current numbers out of the system" it is also important to have transparency and making it easy to get access to your relevant data assets and reports. Very often this is not so easy. Why?
Do you have an overview about all the data and reports in your company?
Do you know the meaning of a new data source or key figures all the time?
Is there a common understanding of terms and how data is produced?
How can data quality be evaluated?
Is your master data consistent?
…
Once you understanding all this, you have very sophisticated tools for doing reporting, analysis and visualisation.
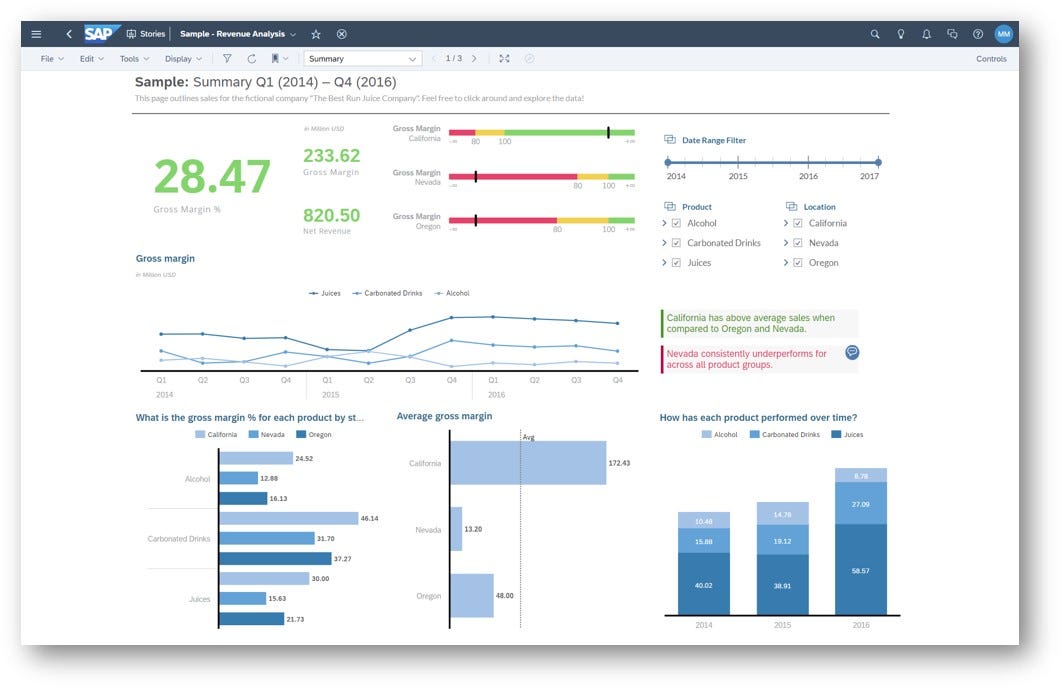
Fig. 2: SAP’s current solution for Analytics - SAP Analytics Cloud - Story (Example)
To create value with this tools, ask yourself the following further questions:
Are you able to understand and use all the functionality of the tool/report? (maybe not necessary for everyone, depending on your responsibility)
Do you understand the visualisation chosen? (think about this 3D pie chart looking nice but no one can really tell you what it means… and how many red bar charts have I seen just because red is the company color…)
How can you communicate findings (you wouldn't believe how often I had seen a print out of a report, notes with a pen, scanned and send by e-mail…)
If you have findings, how can you dig deeper to find the root cause? (you wouldn't believe how often I had seen people asked for the orgin of data that they point just to another report…)
Do you know who to ask for, to add data situational (if you have to open a ticket for IT maybe your situation is over before you get an answer…)
Are you aware of which data is confidential or personal data? (do your know the costs of a GDPR violation…?)
…
Make use of the Driver Assistance System
In the next stage Analytics tools evolve in the direction that Machine Learning (ML) and Natural Language Processing (NLP) enhance Business Intelligence (BI) and reporting to assist and automate insight generation. Generative AI is finding his way into tools like Microsoft Power BI with their Copilot feature. Organisations are evolving and they become more agile, adapting to change and enabling self service activities.
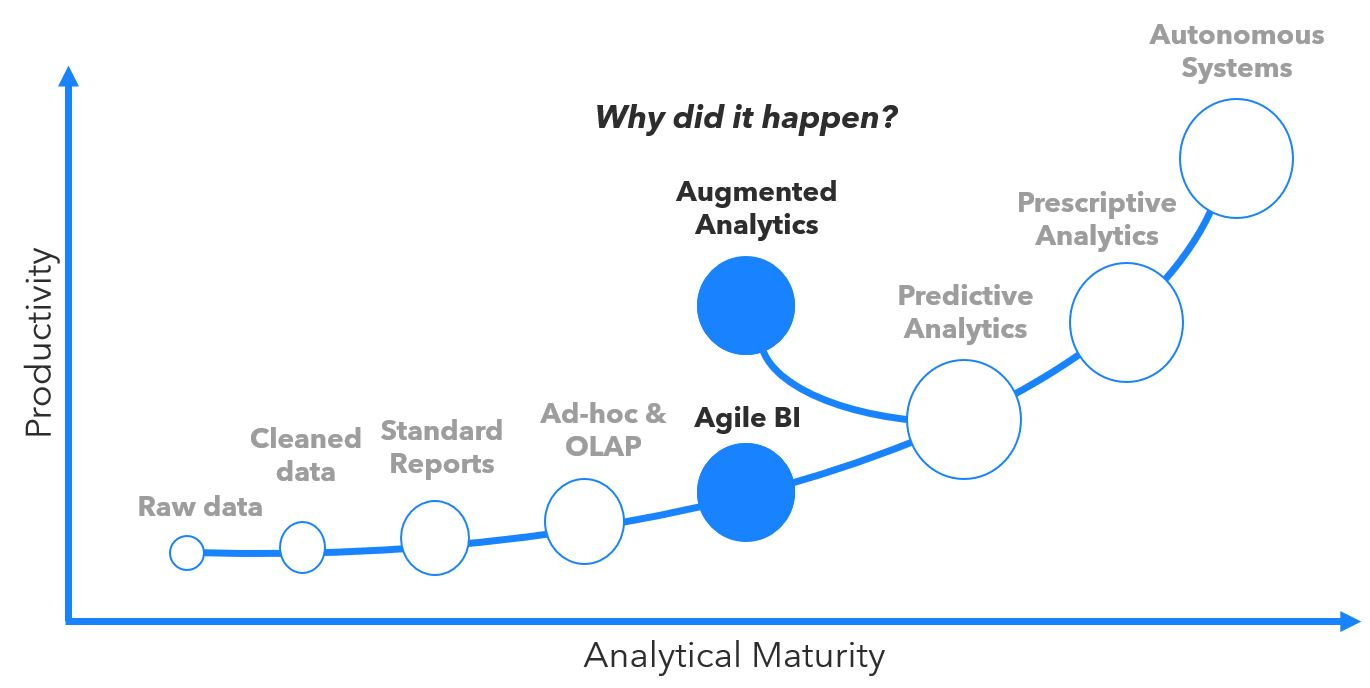
Fig. 3: Analytical Maturity Curve - Why did it happen?
This is where the real challenges begin. Until a few years back OLAP (On-line Anaytical Processing) with drill down, roll up, slicing and dicing was probably the most complex technique for analysing your data. Now ML come into play and analyse pattern and influence factors, forecast time series and cluster data using complex algorithms. And thanks to Natural Language Generation (NLG) you don't even have to understand the visualisation but can just read about the insights (or even let it read out loud).
You can now just use it as it really can be helpful. It is the same as with the more and more assistent systems modern cars have. But this more of technological support (assistance) doesn't free you from your responsibility to know what you do with your car - or here, your data. Using AI brings additional aspects as the need to somehow understand what is behind the algorithms and generative AI harbors risks like hallucinations what you have to understand. Otherwise it is like the 3D pie chart - nice but useless.
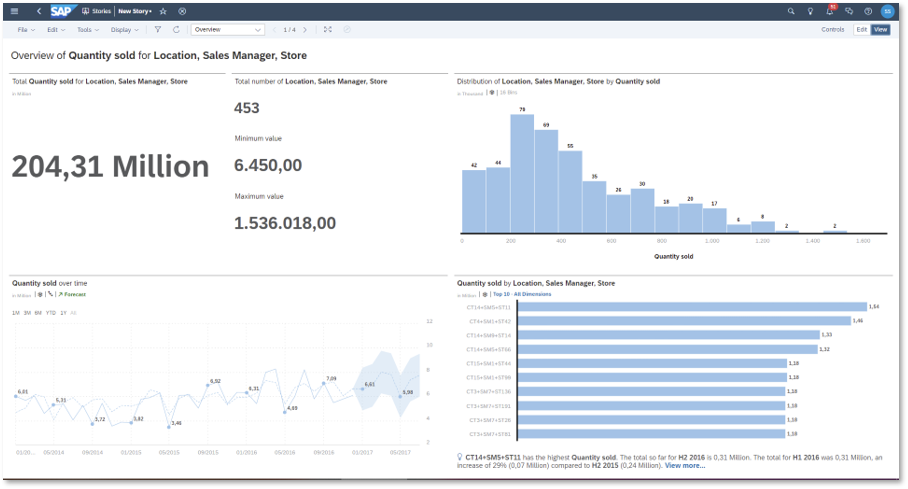
Fig. 4: SAP Analytics Cloud - Smart Discovery - An automatically generated dashboard/story based on your data, powered by AI
With Data Literacy, Augmented Analytics as we see it with the example above, you can accelerate your data usage and data value creation process and really make it a next level tool for your daily tasks. Agile analytics and self-wervice can accelerate adaption to new situations, but need the right data governance and a clear understanding how IT and business work together, otherwise your new capabilities will create data chaos just faster.
To take this step ask yourself:
Do you understand the basics of statistics and linear regression? Do you know what a confidence interval is?
Do you know how trends and seasonality influence a time series?
Do you know how to interpret a boxplot diagrams or a histogram?
Can you distinguish between trivial and relevant findings, that are automatically derived from your data?
Do you know the tools available to you, to independently create reports and integrate own data for analysis purposes?
Are you aware of processes and limitations of self-service data preparation and integration?
Do you have data ownership and data stewardship roles in your organisation and interact with them?
…
In an analysis by OpenAI about the GPT4 model they observed the following "safety challenges":
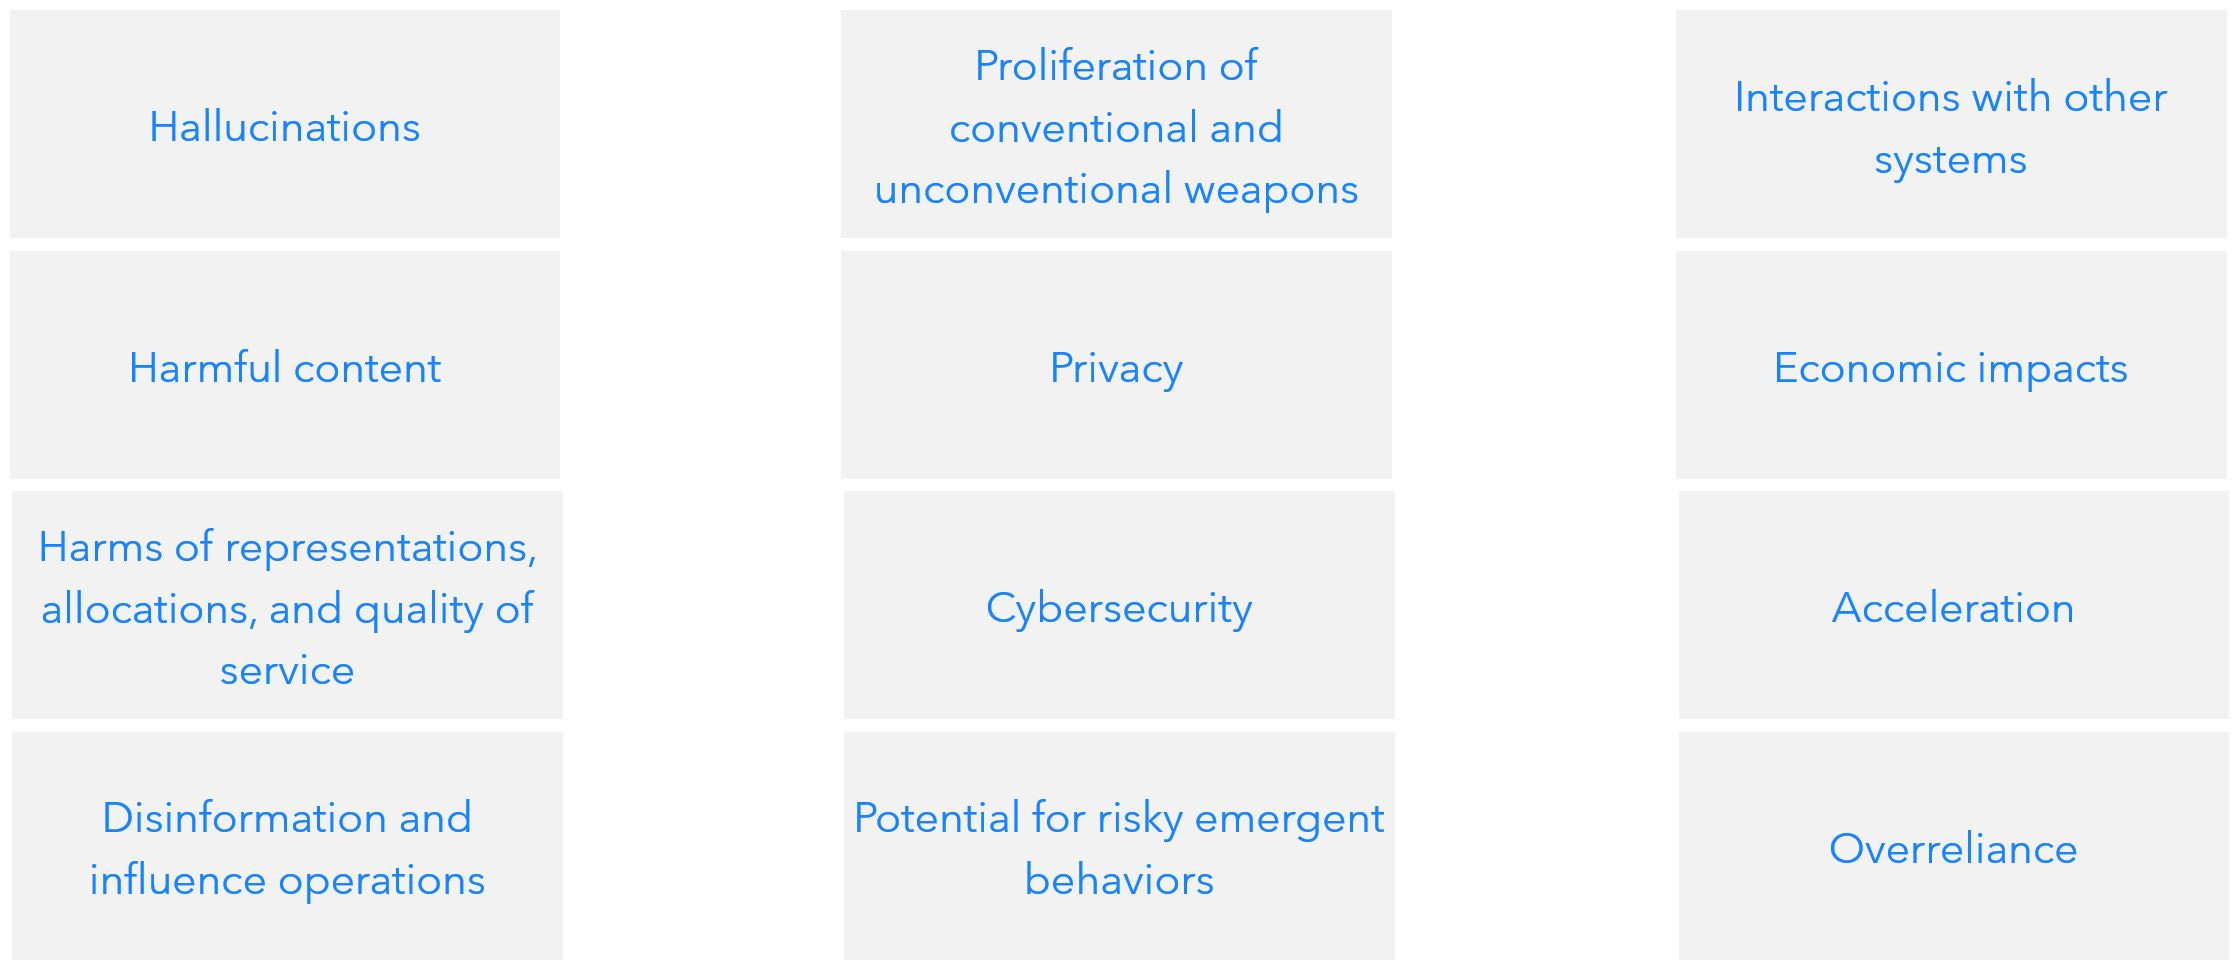
Fig. 5: GPT4 safety challenges found by OpenAI
Currently the experience with generative AI is very dynamic and if we use functionality here, we should first be aware of the aspect, that it is possibly working differently every time you use it.
Accelerate your Way Forward with a (Data) Navigation System
Navigation systems point the way forward and optimise for different paths and outcomes. Already with augmented analytics we have the ability to forecast time series and get som results to get an idea about what is coming next. Companies have established complex planning systems and make use of predictive planning to automate parts and also assist in this process based strongly on market knowledge.
Predictive and prescriptive analytics can take your business forward and make it truly data-driven by automating and forecasting many processes gaining deeper insights into your business through the use of advanced analytics techniques. There are countles use cases for businesses such as:
Clear payments automatically with the intelligent matching of payments and invoices
Save time with automatic cross-company reconciliation and document matching
Centralize invoice processes and increase the automation rate in invoice processing
Increase e-store revenue with product recommendations
Never run out of stock with AI-powered planning
Automatic prediction of missing master data fields for product introduction
Invoice claim processing
…
Machine learning today is embedded in various application from ERP to CRM to business planning systems and enables you to develop own applications to bring it back into the operational context to automate and assist during your daily work.
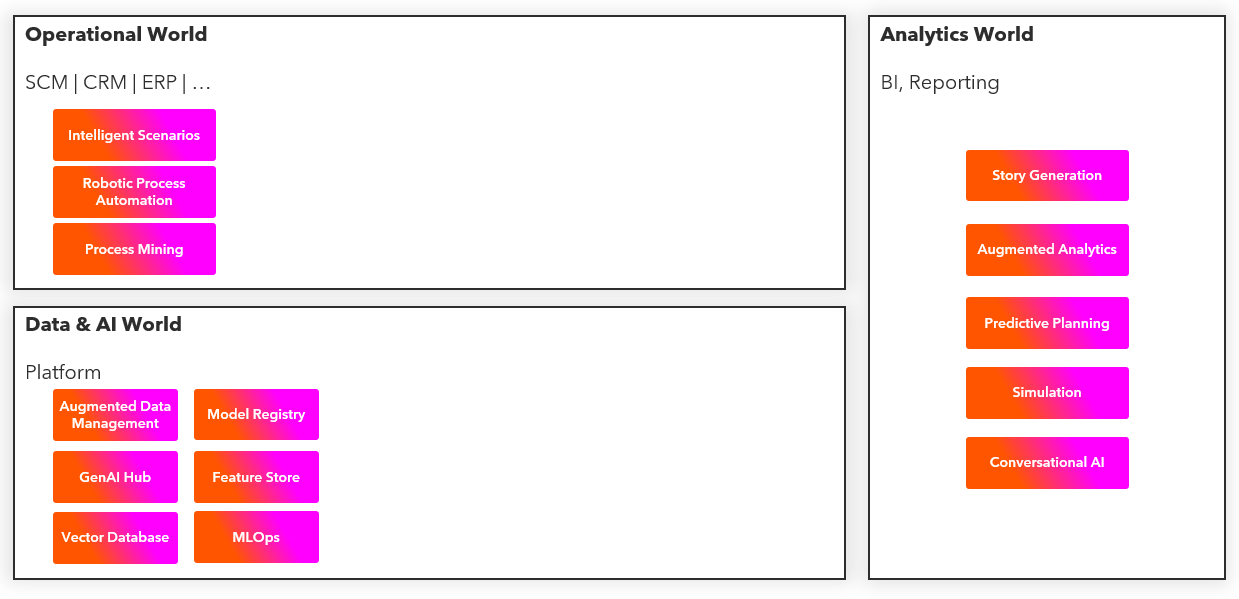
Fig. 6: AI in different system worlds (see Let’s Talk about AI)
New cloud-based AI services, modern AI frameworks like TensorFlow, Keras or PyTorch and other optimisation engines enable the usage of AI and can be embedded and federated in modern architectures.
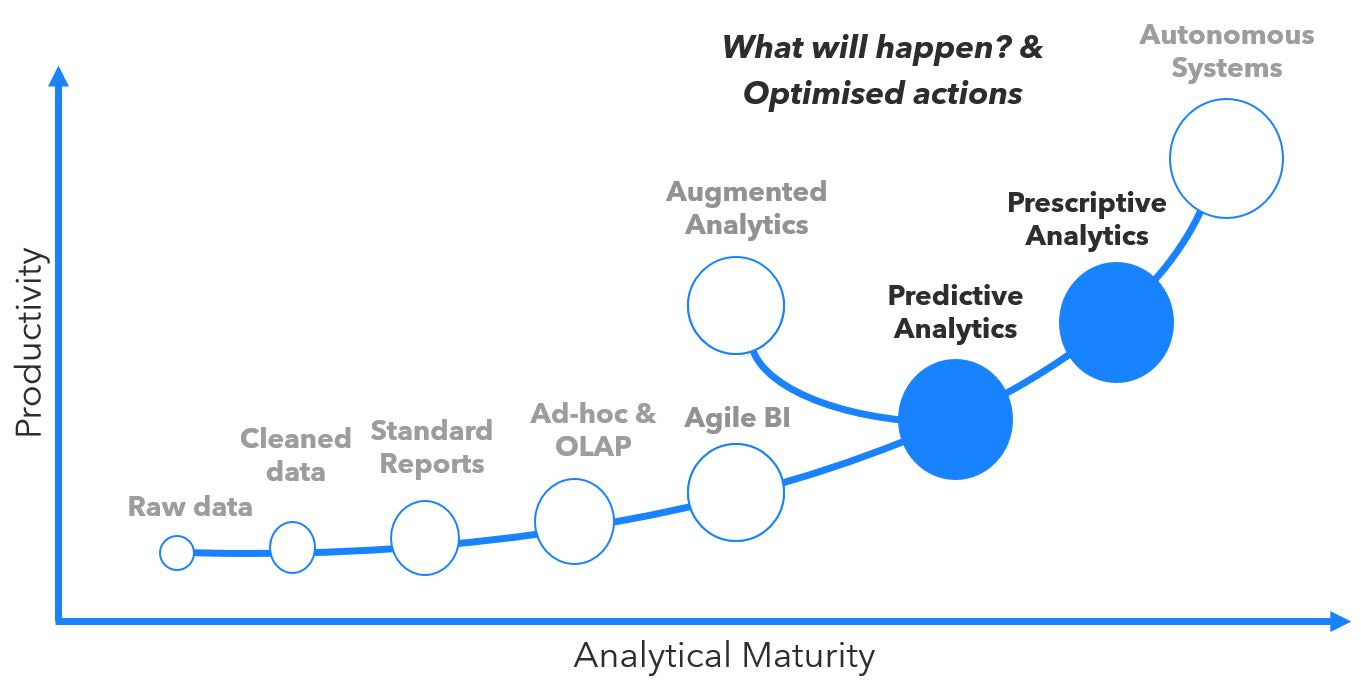
Fig. 7: Analytical Maturity Curve - What will happen? & optimised actions
So this is where personal skills in using data and analytical technologies reach their limit. From here Data Literacy is rather about to generate the idea and understand how to work together with Data Scientists and AI engineers, who are often part of the business domain, to get things done. Use cases need to come from the business side and be applied by the business side. A good understanding of the potentials and possibilities is crucial. In addition, a sense of data quality in the context of data-driven technologies as for ethical standards of automated decisions and bias in data is increasingly important.
Launch the Self-Driving Car for Your Data
Self-driving cars are the high goal and vision of todays car manufacurers. A computer on wheels. But as we see, it is still hard to reach a level where this really works.
We already reached a high level of maturity when we actively use advanced analytics. Digital transformation drives us to go even further and transform our business in a way of autonomous decision and developing new business models based on data and digital technologies.
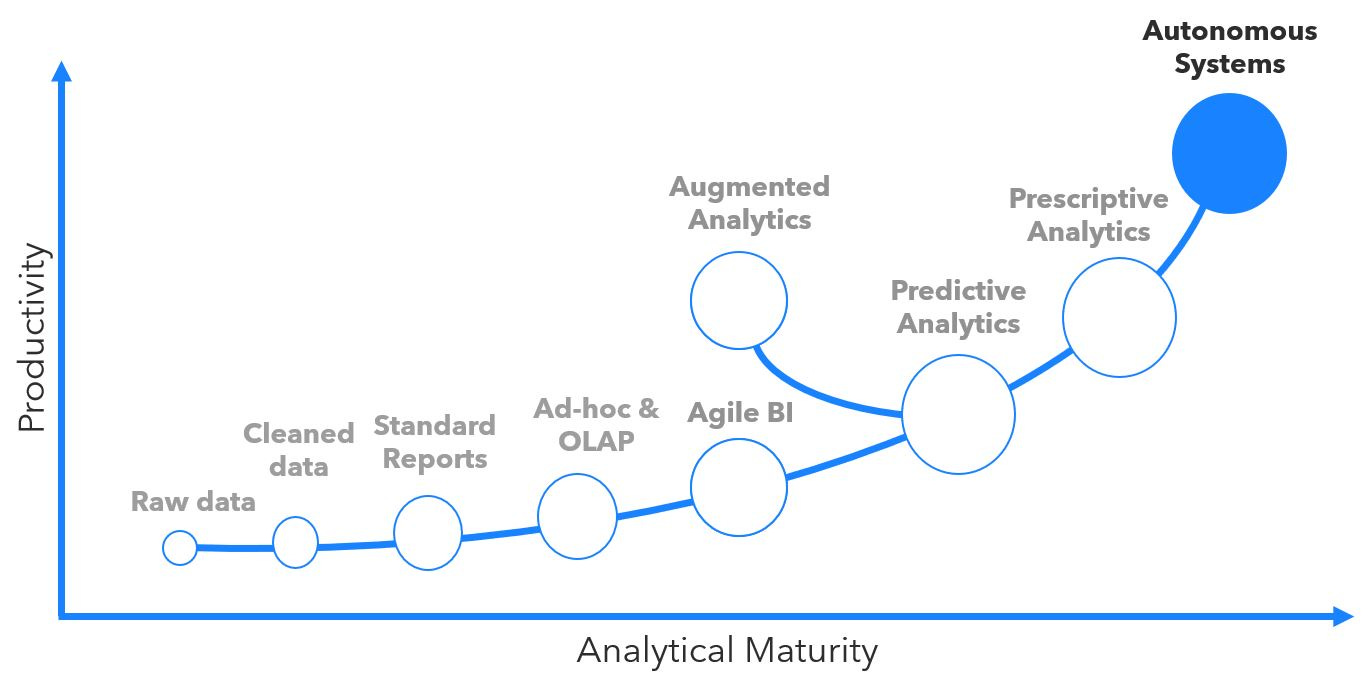
Fig. 8: Analytical Maturity Curve - Autonomous Systems
We are creating ideas using approaches such as Design Thinking and Data Design Sprints to bring data in every aspect of our business and our business model. Data represents your company like nothing else, and understanding that data and make use of it becomes a valuable task to differentiate on the market based on high efficiency, high automation, fast feedack and quick adaption to change.
This level is less a technological one, although the advanced use of artificial intelligence and process mining technologies will help on the way. Since people are the real differentiator using the data and coming up with the right ideas to drive the business, investing in peoples skill is the way to go.
Answering the Question Whether or Not Data Literacy is as Simple as Driving a Car
As you can see Data Literacy can be crucial for the future of your business! Don't just look in the rear view mirror.
It's always the easiest to hire people with the right skill, but you maybe have learned that it's not about being able to work with a tool as little as it is about to drive a car of a specific brand or type. You have to invest in your people as you have to pay and train for a driver's licence and afterwards practice to get better and not produce accidents. Implementing Data Literacy takes time and a plan. It is not about getting a driver's licence and to having a car giving you a great mobility for whatever comes. Also invest in data culture and data governance. Otherwise you will have to drive your Porsche on a dirt track. Instead, empower your organisation to unleash the potential of people, processes, technology and data. You will see that it is worth it.
Happy to hear from you, how your situation about Data Literacy is?
This article was originally published in the SAP Community and adapted to current development an a more general, tool-independent understanding.