You are in Data & Analytics? Here are 9 things you should be aware of, to handle your data right!
1. Simpson's Paradox
Simplified: “When Correlation Does Not Equal Correlation“
Simpson's Paradox describes how aggregated data can lead to the opposite conclusion than the consideration of subgroups. This effect occurs when relationships in the data are blurred or reversed by aggregation. It shows that considering relevant subgroups is crucial for correct interpretations, especially in medicine, sociology and market research.
Go further: Wikipedia | YouTube Tipp
2. Goodhart‘s Law
Simplified: “Measuring The Wrong Things Drive Immoral Behaviour“
Goodhart’s Law states that “When a measure becomes a target, it ceases to be a good measure“. In data analytics, this means that once a particular metric is set as a success criterion, incentives are often created to manipulate that metric without improving the underlying performance. This phenomenon is common in areas such as finance, education and corporate management.
Source: xkcd
Go further: Wikipedia | YouTube Tipp | Cobra Effect
3. Confirmation Bias
Simplified: “Seeing What You Want to See” / “Inside the Bubble”
Confirmation Bias occurs when people favor information that supports their pre-existing beliefs. In data analysis, this can mean that analysts only select data that confirms their hypothesis and ignore contrary data. This can lead to biased interpretation and is a common problem in exploratory analysis and hypothesis generation.
Go further: Wikipedia | YouTube Tipp
4. Survivorship Bias
Simplified: “Ignoring the Unseen Failures”
Survival Bias occurs when only the “surviving” or successful data are analyzed, while unsuccessful cases are ignored. This can lead to a distorted interpretation. A classic example is the analysis of start-up successes, where failed start-ups are often not considered and the probability of success is therefore overestimated. It is a type of Selection Bias.
Source: Wikipedia
Go further: Wikipedia | YouTube Tipp
5. Selection Bias
Simplified: “An Element Don't Always Represent the Whole”
The Selection Bias occurs when a sample is not representative of the population. This is a common problem in data analysis and can lead to systematically distorted results, as certain groups are over- or underrepresented.
Go further: Wikipedia | YouTube Tipp
6. Benford’s Law
Simplified: “The First-Digit Law”
It describes the surprising phenomenon that in many natural data sets, the first digit of numbers is more often a small number. Specifically, this means that the digit 1 occurs more frequently as the leading digit than the digit 2, the digit 2 more frequently than the 3, and so on, up to the digit 9, which occurs the least frequently. The distribution of the leading digits in a typical data set follows a logarithmic distribution and can be calculated using a formula.
Source: Wikipedia
Go further: Wikipedia | YouTube Tipp
7. Planning Fallacy
Simplified: “Your Plan is Always to Optimistic”
The Planning Fallacy describes the systematic tendency of people to underestimate the time or resources required for a task. In projects, this effect can lead to unrealistic expectations and inaccurate schedules, even in data-related projects or analyses.
Go further: Wikipedia | YouTube Tipp
8. Clustering Illusion
Simplified: “To see Patterns, where no Patterns Exist”
The Cluster Illusion is the tendency to see patterns or “clusters” in random data. This can be particularly problematic in data visualization when analysts attribute meaning to random fluctuations that are really just coincidence.
Go further: Wikipedia | YouTube Tipp
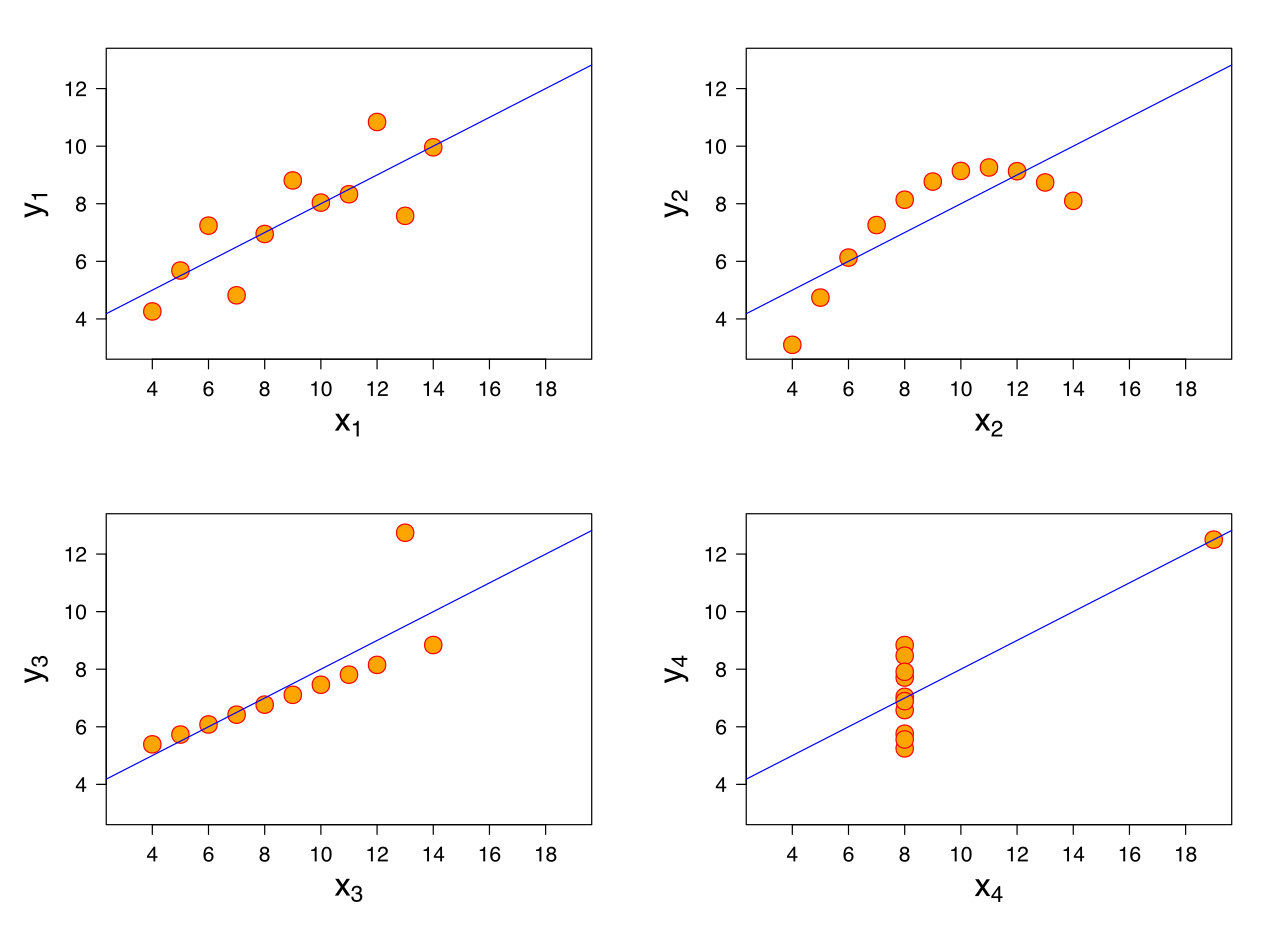
9. Anscombe's Quartett
Simplified: “Statistic is Sometimes Not Enough”
Anscombe's Quartet is a group of four data sets developed by statistician Francis Anscombe. These data sets have identical statistical measures, such as mean, variance and correlation, as well as very similar linear regression lines. However, they differ greatly in their visual representation and have very different data distributions and trends, which only become visible through a graphical representation.
Source: Wikipedia
Go further: Wikipedia | YouTube Tipp
Let me know if you have already experienced any of these effects with data. Did you experienced further effects?


