Exploring KNIME - L1-DS
KNIME Analytics Platform for Data Scientists: Basics

KNIME is a graphical Data Preparation and Machine Learning tool enabling users to build transparent and easy to communicate workflows.
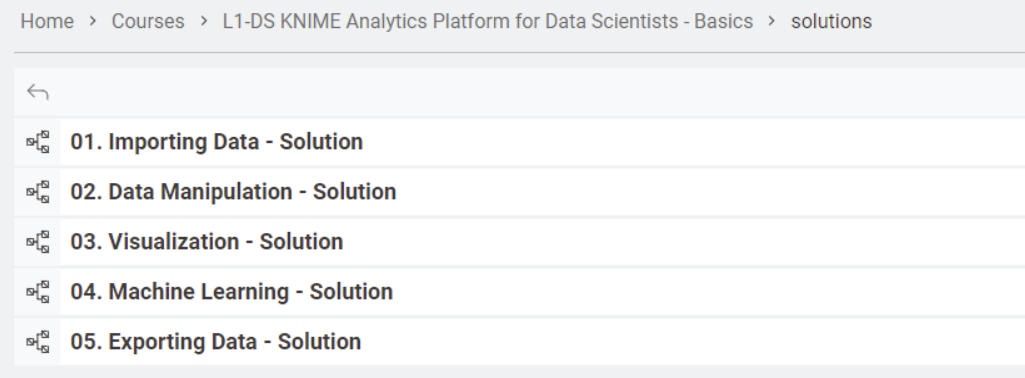
L1-DS is the first course (Level 1) for the Data Science (DS) training. KNIME offers exercises with data and also solutions to get a better understanding of best practice in workflow modeling. Training slides can be found here. There are the following 5 exercises:
In this Blog I want to explore workflow 4 - Machine Learning.
Decision Tree
The first workflow includes Decision Tree algorithm. Decision trees are supervised ML algorithms. This means you need example data with a label to learn from.
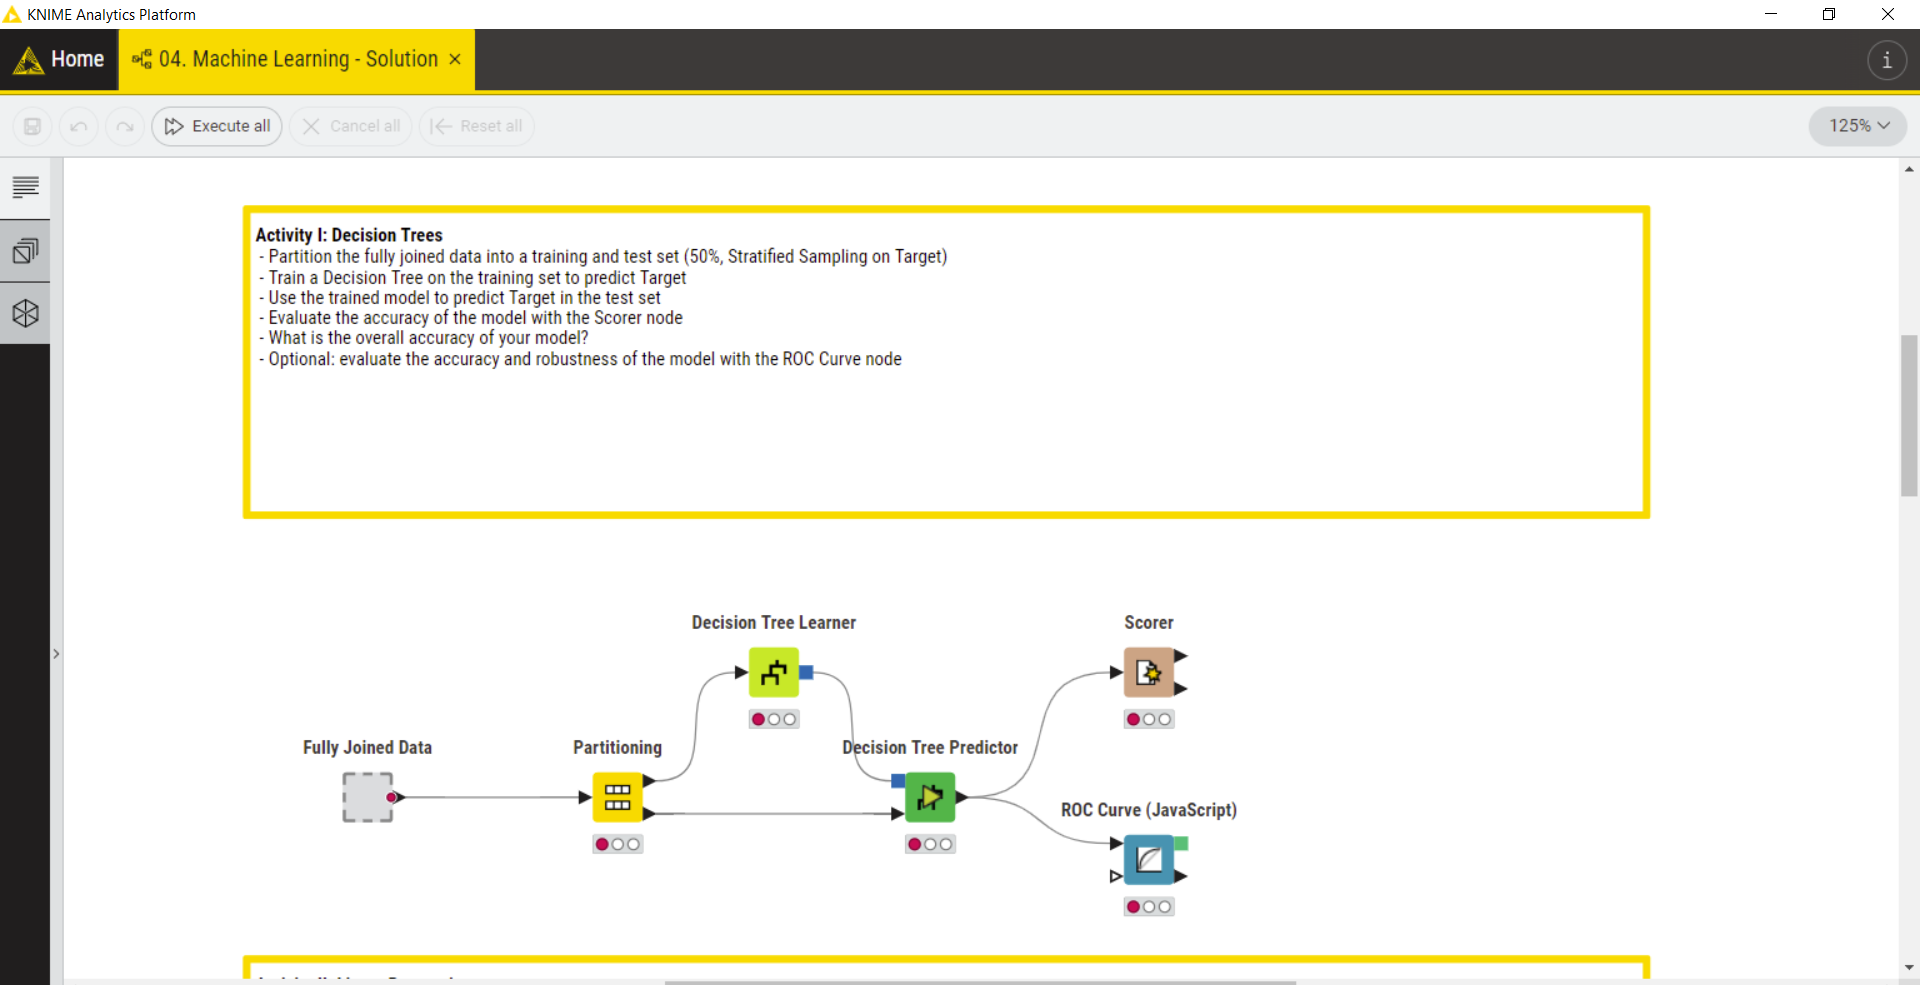
You can find a documentation and also a video on YouTube explaining how the Decision Tree nodes work.
The first node of the workflow is the metanode “Fully Joined Data” which wraps the data preparation process:
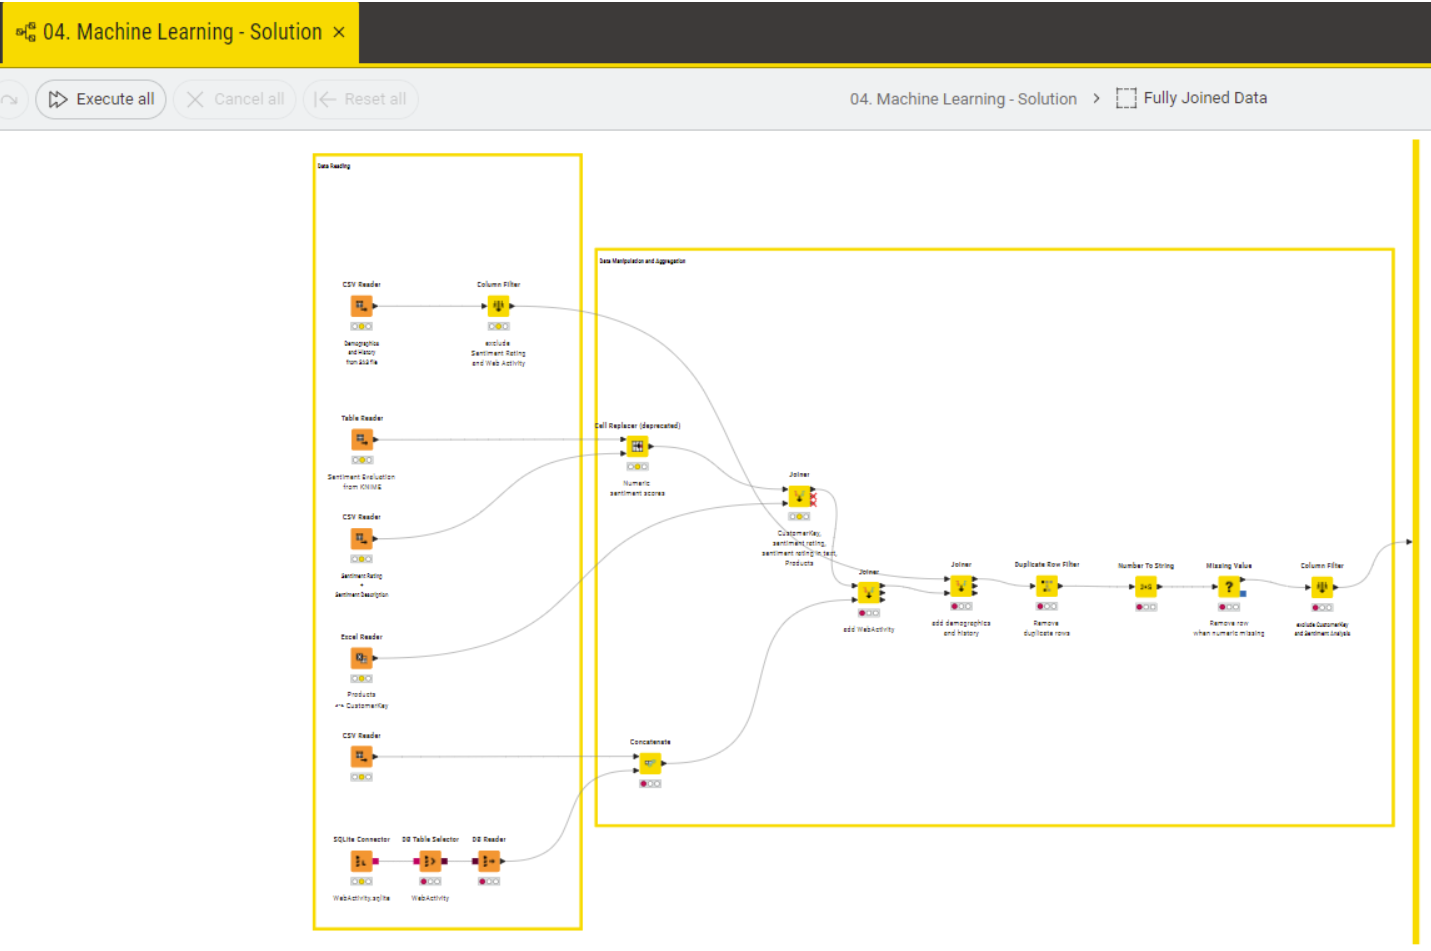
Different datasets are read, joined and transformed to provide the right data for the next steps of preparing the machine learning. The join is supported by a graphical representation and different parameters can be used to define output, key handling, performance:
For the machine learning data is split in training and test data with a 50:50 ratio in standard and is using a stratified sampling of the target variable.
Stratified sampling
i.e. the distribution of values in the selected column is (approximately) retained in the output tables. You may optionally specify a fixed seed.
To train the decision tree with the training data there are several parameters possible but most defining is the quality measure "Gini Index" and the "Gain Ratio". A explaination can be found here.
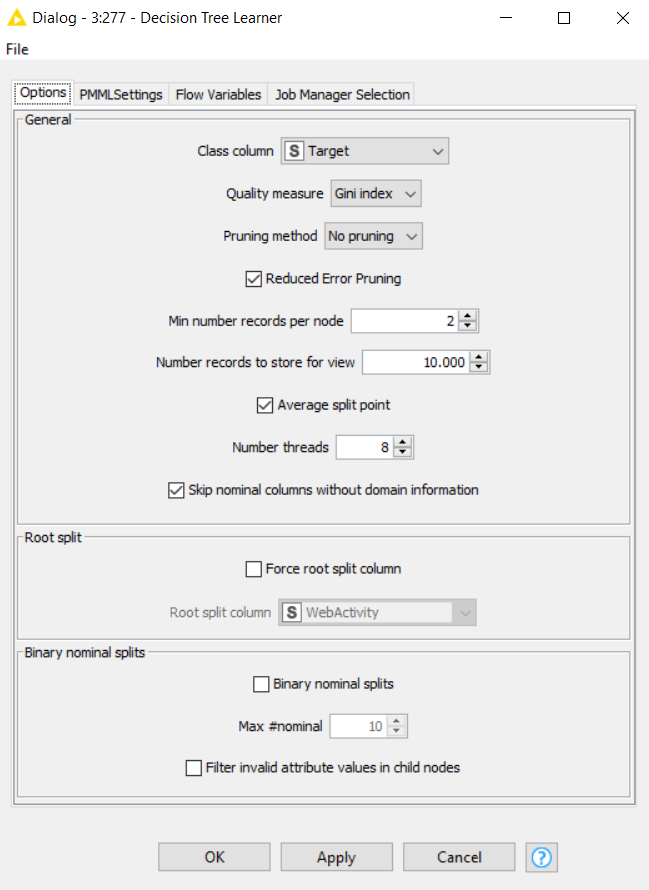
Pruning on the other side is very important to prevent overfitting. Results from Decision Tree Predictor shows that there is typically no 100% fit for “Target” Prediction:
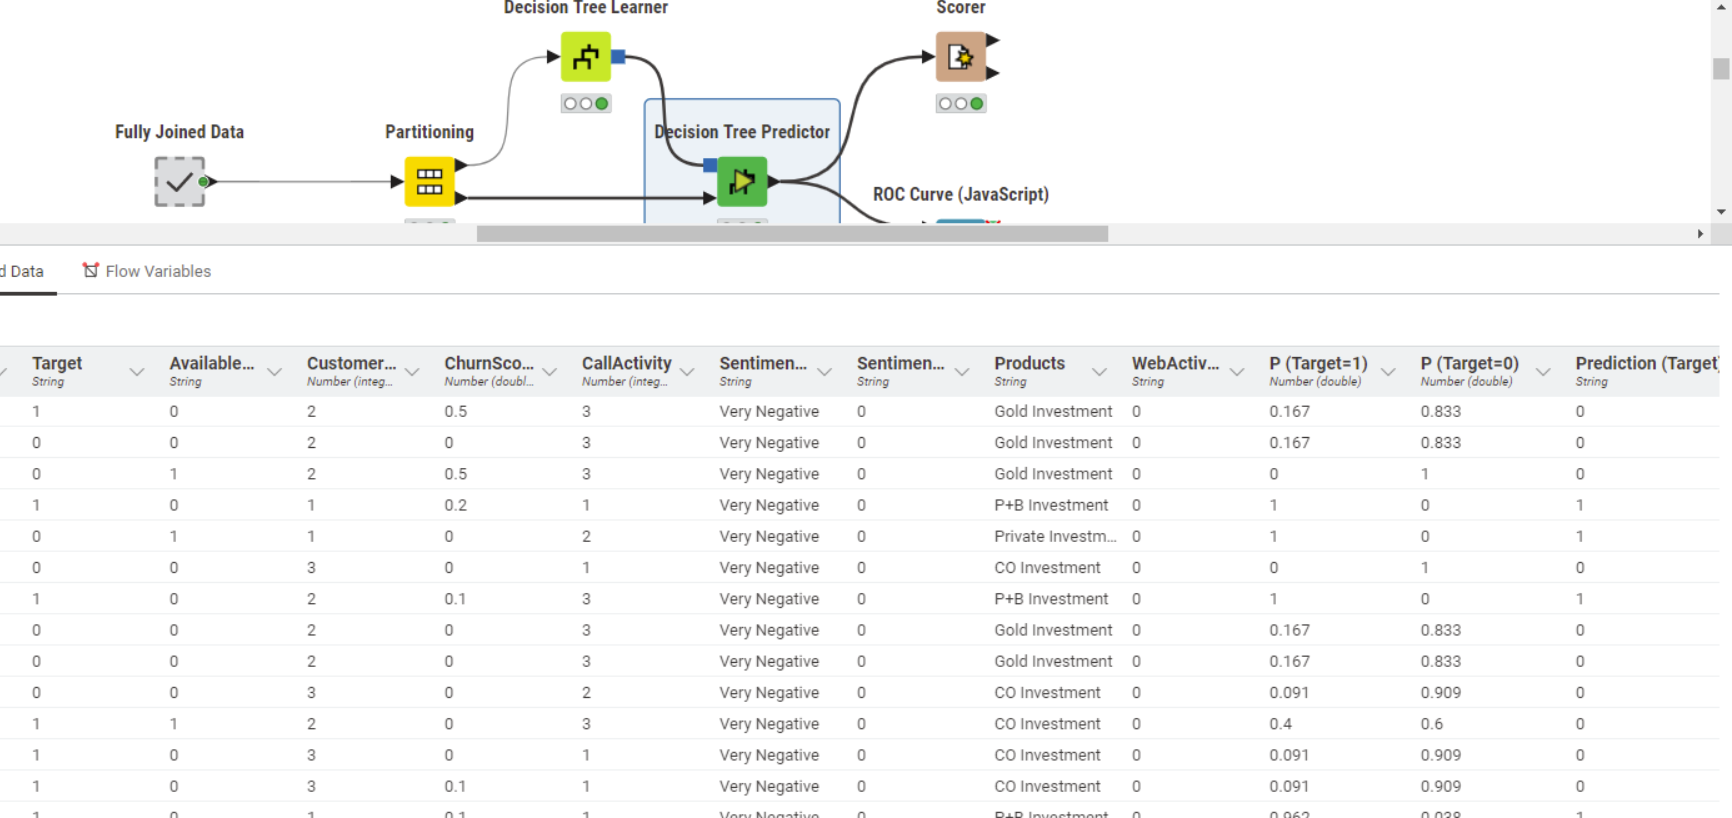
Our whole dataset is 11551 records and 15 columns to learn from data and test prediction of a value to new records.

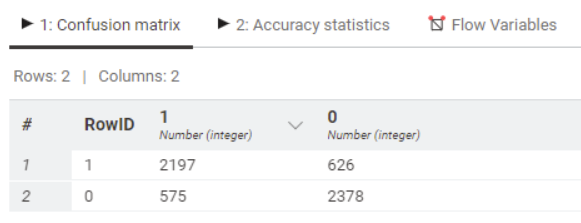
One way to understand how well new data would be predicted is the confusion matrix:
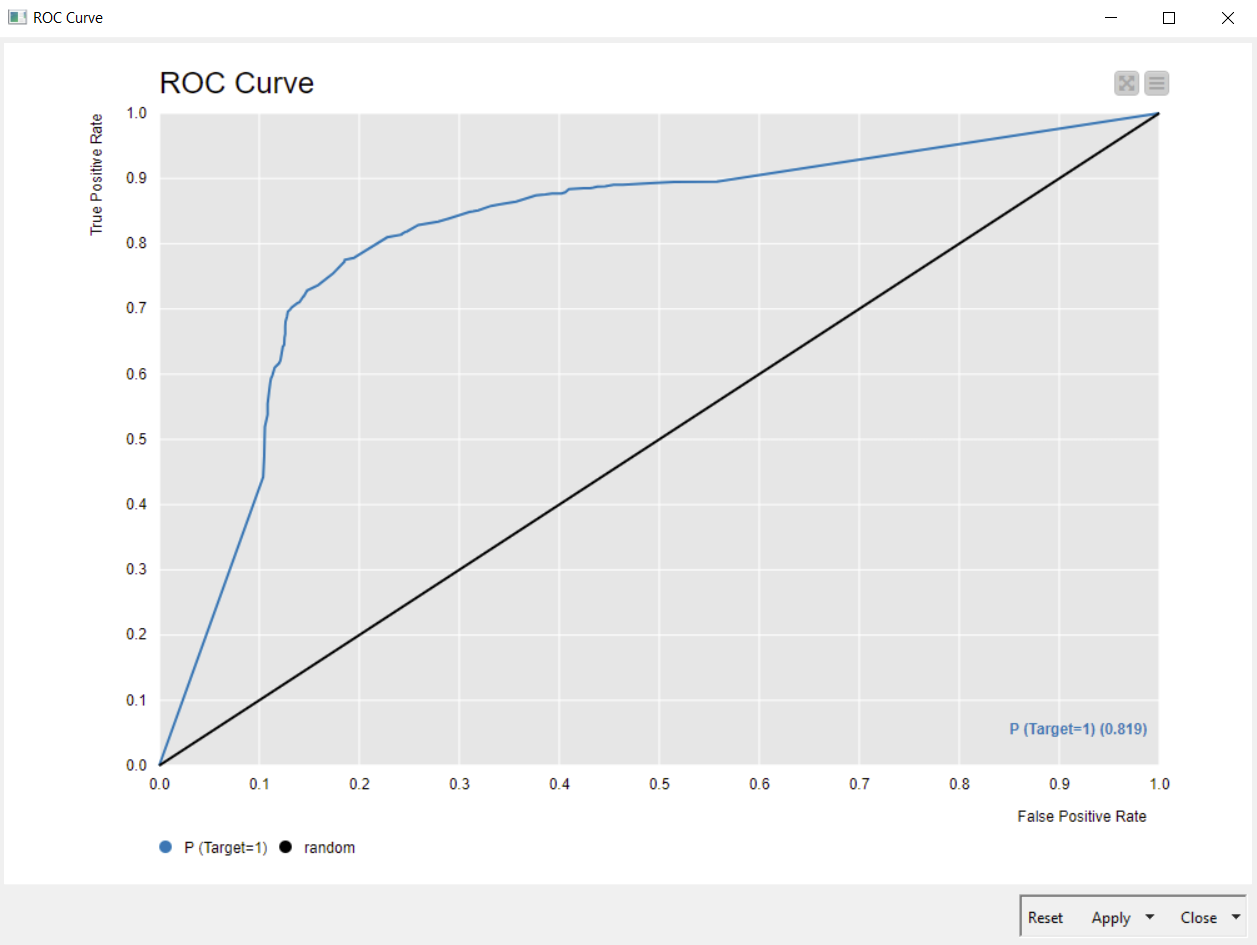
Another graphical approach is the ROC (receiver operating characteristic):
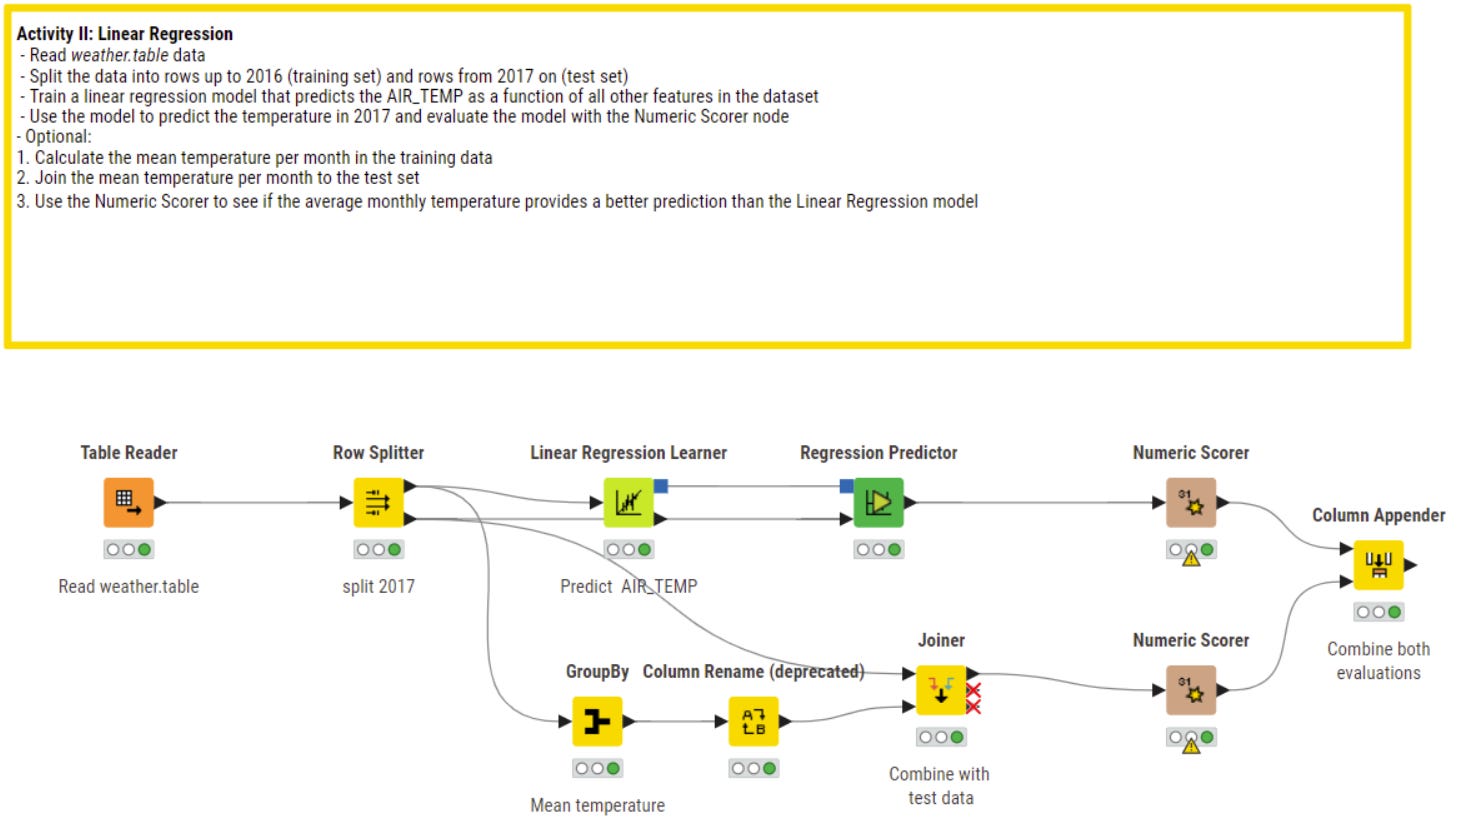
Linear Regression
This algorithm is very popular for numeric prediction and even if not always data shows a linear relation, for these kind of problems it is often the reference where you can prove a to find a better solution or algorithm.
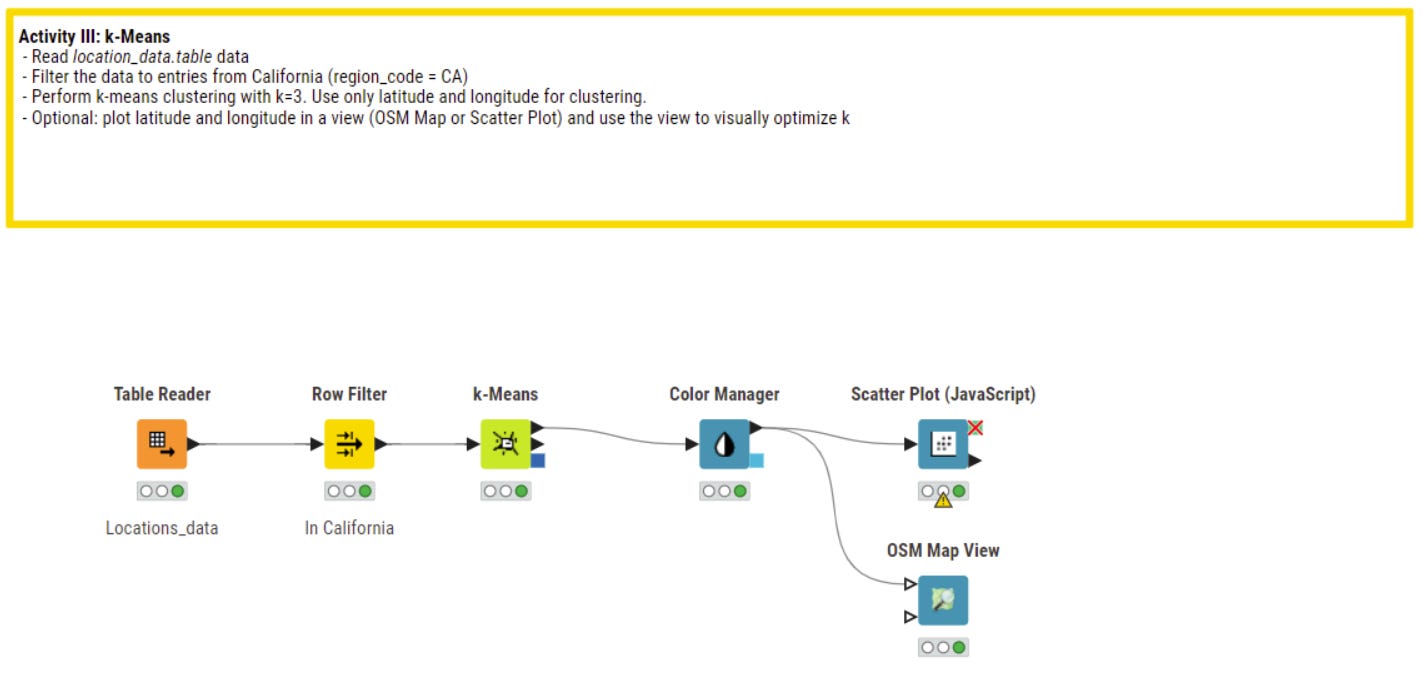
K-Means (Clustering)
The third algorithm is k-means for clustering of data. Compared to decision tree and linear regression k-means is a unsuperviced method of machine learning. This means that you don’t need labeled data for a learning process but directly try to find patterns (clusters) from available data.